
Are Americans as Healthy as They Believe?
Study shows most adults won't face the truth about their health
August 2019
America’s problems with obesity, type 2 diabetes, mental health and other issues have gotten worse over the past few decades.
But chances are, you don’t think your own health is part of the problem, according to our recent survey findings.
Nearly 9 out of 10 people we surveyed described their own health as either “good,” “very good” or “excellent,” despite the same people also reporting low levels of exercise and poor diets.
A similar study conducted in 2009 found pronounced discrepancies across self-rated health responses from people with different education levels.
How far-reaching are these misperceptions? Are Americans really that out of touch with their own health?
Key Findings From Our Study:
- 68% of obese Americans say they're as healthy or healthier than the average American.
- 48% of people who consider themselves healthier than previous generations are overweight.
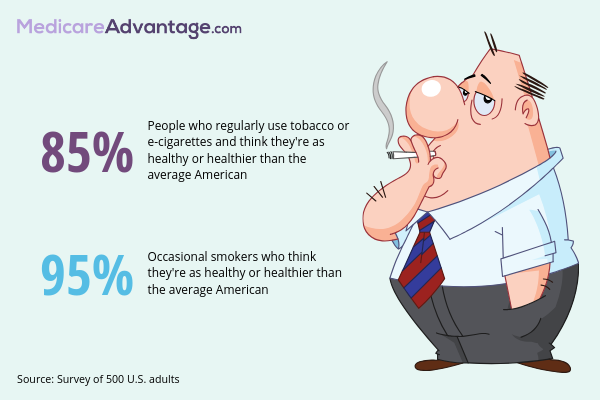
- 85% of regular tobacco or e-cigarette users think they’re as healthy or healthier than the average American.
- 87% of people who never or infrequently eat vegetables report to be in “good” or “excellent” health.
- 77% of people who never or infrequently work out believe they are in “good,” “very good” or “excellent” shape.
- 62% of those who report they’re less healthy than their parents were at the same age also think they’re as healthy or healthier than the average American today.
Less Than 50% of Adults Admit to Being Overweight
The data we collected supports the notion that people generally have a distorted view of their own health. They are largely unwilling to admit how unhealthy they are, and they grossly overestimate their health compared to the average American today and the average American 50 years ago.
Nearly three-quarters of American adults are either overweight or obese, but less than half of our survey respondents would admit to being overweight.
85% of regular smokers think they’re just as healthy or even healthier than the average American.
“People tend to overestimate their own health. They may think they are more physically fit than they are. They also may compare themselves to others who they think are in worse health based on how they may look or act.” - Dr. Monique May, M.D.
Americans Have a Distorted Body Image
When people look at themselves, are they looking through a fun house mirror and seeing a distorted image? Just 47% of our survey respondents fessed up to being overweight, despite the Centers for Disease Control and Prevention (CDC) reporting that more than 71% of American adults are overweight or obese.1
Those responding to the survey likely also underreported their weight. According to the CDC, the average Body Mass Index (BMI) is 29.1 for men and 29.6 for women.2 But our male respondents reported height and weight figures that yielded an average BMI of just 26.6, and our female respondents answered with data that led to an average BMI of just 27.4.
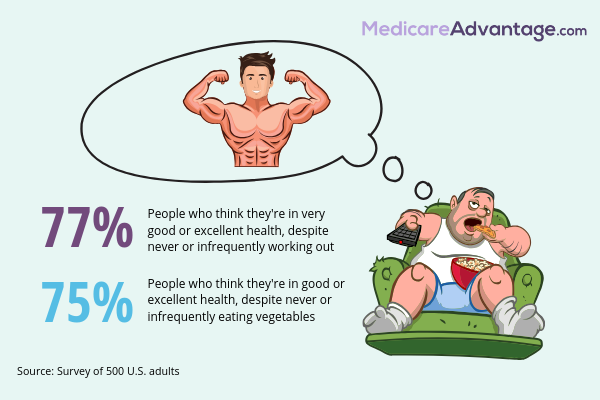
Our respondents, however, did tend to overestimate the health of their lifestyle habits. Of people who reported being in good or excellent health, 77% report never or infrequently exercising for at least 20 minutes.
75% of the same group who claim to be in good or excellent health also admitted to never or infrequently eating at least 1-2 servings of vegetables in a day.
The view of American fitness averages at large may also be just as distorted.
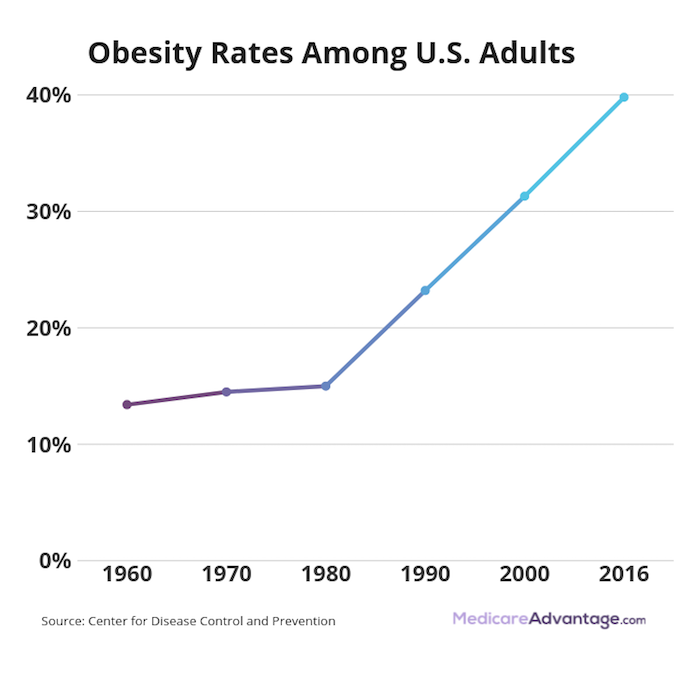
It’s no secret that the United States is among the most overweight and obese countries in the world (15th, to be exact).3 What many fail to realize, though, is just how much American waistlines have inflated over the last 50 years.
In 1970, the rate of adult obesity in the U.S. was less than 15%.4 Today, that figure is nearing 40%, an all-time high.5
So as more Americans are becoming obese, is the perception of “normal” weight inflating as well?
All told, 85% of our respondents claimed their health was at least similar to that of the average American, with 56% claiming their health was “somewhat” or “much” healthier.
American Diets Are Getting Less Healthy
Of the survey respondents who reported never or infrequently eating fruits or vegetables, only 4% admitted to being in poor health. And half of these fruit and veggie abstainers claim their health was “generally similar” to that of the average American, while nearly half also claimed to make healthy food choices.
Meanwhile, 76% of all people surveyed reported overeating to the point of discomfort at least once per week, and 69% reported not following any sort of diet.
“There’s a tendency to underreport intake and weight gain that are perceived as being ‘bad’ and overestimate physical activity which is usually perceived as being ‘good.’ I see this often when I ask clients to tell me about how much they’ve eaten, recent weight changes, or how active they are.” -
Angela Stancil, M.S., R.D., L.D.N.
People Are Not Honest About How Much They Exercise
Exercise is another area where our survey indicates people may not be entirely honest with themselves.
Half of all respondents reported exercising at least three times per week. And 41% reported being active or very active. 77% claimed to exercise at least once a week.
In truth though, only 23% of American adults get enough exercise, according to the CDC.6
Many Smokers Don’t Acknowledge Their Risky Health Behaviors
Of all survey respondents who were smokers, an astounding 85% believed they were at least as healthy as the average American, including 49% who believe they are healthier than the typical American.
Susan Lakoski, M.D., associate professor of cancer prevention at MD Anderson Cancer Center at the University of Texas, would be quick to challenge that notion.
“The biggest myth I hear is that if someone exercises they can offset the negative effects from smoking,” Lakoski said in a 2016 article about the myth of the “healthy” smoker.7 “But that’s absolutely not the case.
“Smoking is one of the strongest risk-factors for every chronic disease, including heart disease and cancer.”
According to the CDC, smoking is the leading preventable cause of death in the U.S.8 More than 10 times as many U.S. citizens have died prematurely from cigarette smoking than have died in all of the wars fought by the U.S.
Adults Falsely Believe Their Lack of Sleep Doesn’t Affect Their Health
Sleep may not get as much popular attention as diet or exercise, but it can have just as big of an effect on health. A lack of Z’s is associated with obesity, heart disease, high blood pressure, diabetes and more.
Sleep is also an area where many people are only fooling themselves.
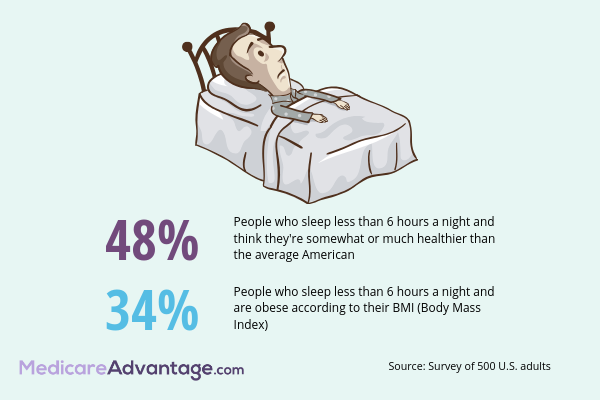
Of our survey respondents who reported fewer than six hours of sleep per night, more than 82% described themselves as “very” (17%) or “somewhat” (65%) health conscious. And 84% described their health as “good” (43%), “very good” (34%) or “excellent” (7%).
Just 1% of this group admitted to being in poor health.
Nearly half (48%) of these respondents claimed they were either “somewhat” or “much” healthier than the average American, while another 31% claimed to be in “generally similar” health.
American Health Today vs. the Past 50 Years
We asked our survey respondents to compare their health to the health of Americans from the previous generation. And the results were similar in how broadly people tend to overestimate their individual health.
- Nearly half of the people who consider themselves healthier than previous generations are in fact overweight or obese.
- 1 out of every 3 respondents who is obese considered themselves healthier than their parents were at the same age.
- Of those who report they are less healthy than the average American today, 43% still believe their health compares similarly or more favorably than their parents at the same age.
Not only are there a myriad of ways that Americans have become less healthy over the last few decades, but people also maintain a faulty perception of how they each fit into those trends.
“We are a more sedentary society. Our food supply is more detrimental to healthy living. Pollution in the oceans contaminates the fish we eat. Of course, smoking, excessive alcohol usage, unsafe sexual practices, proliferation of gun ownership, underuse of seatbelts and obesity also play a negative role in the health of Americans.” -
Dr. Monique May, M.D.
Obesity and Diabetes Are at Record Levels
Obesity now accounts for 18% of all deaths among Americans ages 40 to 85.9
In 2016, 39.8% of American adults are obese, up from 13.4% in 1960.10
The effects of the obesity epidemic are far greater than needing a longer belt.
Obesity carries an increased risk of heart disease, high blood pressure, strokes, osteoarthritis, certain types of cancers, mental health disorders, sleep apnea, gallbladder disease and type 2 diabetes.
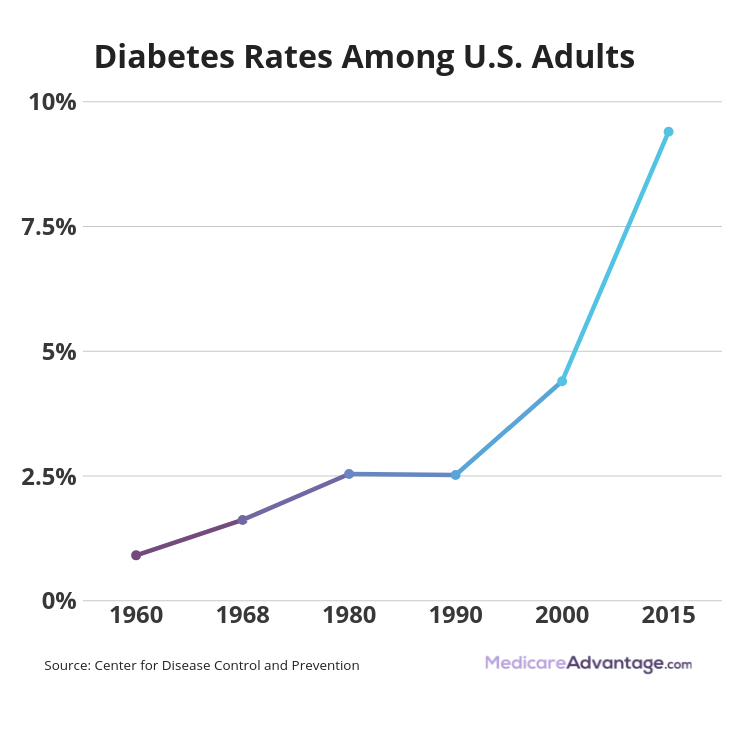
In 1969, fewer than 2% of people in the U.S. had type 2 diabetes.11 Today, more than 9% of Americans are affected by the disease, and an additional one-third of adults are believed to have prediabetes.12
Cancer Diagnosis Rates Are Rising
Cancer research has advanced leaps and bounds over the last five decades. Treatment is more effective than it was in 1969, and the cancer mortality rate has dropped considerably.
But despite getting better at treating various types of cancer, the American health care system seems to be getting worse at preventing it.
- From 1975 to 2016, the rate of new cases of all types of cancer increased from 400 per 100,000 people to 434 per 100,000.13
- Since 1990, the percentage of the U.S. population living with cancer has increased from 4.85% to 5.42%.14
- The overall incidence rate of basal cell carcinoma (the most common type of skin cancer) increased 145% from 1976 to 2010.15
Below are nine types of cancer that saw an increased incidence rate of new cases between 1975 and 2016.13 Even when controlling for modern-day screening protocols, they still all show increases since 2010. Incidence rates are shown per 100,000 people.
| Cancer Type | 1975 Rate of New Cases | 2016 Rate of New Cases | Percentage Increase From 2010 to 2016 |
|---|---|---|---|
| Liver | 2.6 | 8.6 | 4.9% |
| Pancreatic | 11.8 | 12.9 | 2.4% |
| Thyroid | 4.8 | 14.5 | 3.6% |
| Breast | 105.1 | 129.8 | 2.1% |
| Kidney | 7.1 | 15.4 | 2.7% |
| Melanoma | 7.9 | 25.4 | 6.3% |
| Soft tissue (including heart) | 2.2 | 3.5 | 2.9% |
| Testicular | 3.7 | 6.2 | 5.1% |
| Anus | 0.8 | 1.9 | 11.8% |
Arthritis Rates Have Doubled Since WWII
A study from Harvard University that found arthritis of the knee is 2.6 times more common in adults age 50 and over who died between 1976 and 2015 than those who died between 1905 and 1940.16
And that came after researchers controlled the findings for age and body mass index.
Asthma Rates Have More Than Doubled Since 1980
In 1980, there were approximately 6.8 million Americans living with asthma (3% of the population).17
Today, that number has swelled to more than 25 million (7.6% of the U.S. population).18
Suicide and Mental Health Issues Are On the Rise
In 1987, mental illness was limited to 1 out of every 184 Americans. By 2007, it was 1 out of 76.19
With more advanced detection and diagnosing, the rate of mental illness diagnoses has continued to increase since 2007, especially among younger adults. Research published in the Journal of Abnormal Psychology found a 63% increase in depression from 2005 to 2017 among adults ages 18 to 25.20
Among the many consequences of depression and mental health disorders is suicide, which is at its highest rate since World War II.
In 2017, the suicide rate in America was 14 per 100,000 people, up from 12.7 in 1969.21 But what’s even more alarming is how fast the rate has risen since hitting an all-time low of 10.4 in 2000.
The Rate of STDs Is Rising
In the last five years alone, syphilis cases have increased by 76%, and incidents of gonorrhea have gone up 67%.22
Rates of syphilis, gonorrhea and chlamydia have reached record highs, according to the CDC.
Carpal Tunnel Syndrome Is More Common and “Text Neck” Is a Thing
From the early 1980’s to the early 2000’s, the incidence rate of carpal tunnel syndrome rose 64%, from 258 cases per 100,000 people to 424 per 100,000 people.23
While typing on a computer wears and tears your hands, tapping out messages on a cell phone does equal damage to your neck and spine. “Text neck” is an unofficial moniker for pain and posture problems in the cervical spine developed through prolonged use of a cell phone or tablet.
Also worth mentioning are similar tech-related complications such as “texting thumb” (the constricting of the thumb’s flexor tendon that happens as a result of repetitive gripping motions of a cell phone) and “selfie elbow,” or pain and inflammation in the elbow joint from repeatedly extending an arm to take a selfie.
Opioids Are One of America’s Biggest Health Threats
While the drug addiction rate in America has remained largely unchanged since 1970 (hovering between 1-2% for 40 years), the drugs people take today have become more dangerous and deadly.24
In 1970, the rate of death by drug overdose was just over 1 per 100,000 residents.25 In 2017, that number was approaching 22 per 100,000.26
The emergence of prescription opioids has been the greatest contributor to the rising death toll, as opioids now account for two out of every three overdose deaths.27
Men Are Less Fertile
The sperm of men in the United States and Europe has been decreasing both in number and efficiency for quite some time now.
A 1992 landmark study published in the British Medical Journal found “a genuine decline in semen quality over the past 50 years.” 28
Another study published in 2017 found that sperm counts of men from North America, Europe, New Zealand and Australia declined more than 50% from 1973 to 2011.29
The reasons for this downward trend remain unclear, but some scientists point to the high level of chemicals people are increasingly exposed to in everyday life.
Adults Are More Nearsighted
According to the American Academy of Ophthalmology, the percentage of people in the U.S. who are nearsighted is on the rise.30 Researchers don’t fully understand the reason, but they look to a combination of lifestyle factors as possible contributing factors.
People are spending more time indoors, where your eyes can’t relax as fully as they do in natural daylight. This prevents distant objects from focusing clearly on the retina, which in turn triggers the development of near-sightedness.
People's eyes are also spending more time fixated on screens, which forces the eye muscles to work harder and elongate over time, which also contributes to near-sightedness.
America Is Losing the Battle Against Alzheimer’s
There are plenty of examples of ways that Americans aren’t living as well as they once did. And there’s at least one example of how they aren’t aging as well either.
Since 2000, there has been an 89% increase in deaths from Alzheimer’s, and every state in the U.S. is projected to see at least a 14% rise in Alzheimer’s prevalence by 2025.31
Of course, a big reason for this surge is the baby boomer generation aging into the Alzheimer’s risk pool.
Childbirth Is More Dangerous for Mothers
Over the past two decades, the maternal mortality rate (mothers who die from pregnancy-related complications) has more than doubled in the U.S.32
The U.S. is the only developed nation in the world with a maternal mortality rate that is increasing.
How Did American Health Get to This Point?
There are many ways in which Americans are less healthy than they were in 1969. Likely unsurprising are the many ways in which the American overall lifestyle has become less healthy during that time.
Americans eat more sugar.
In the late 1970’s, the highest average of added sugar people were consuming daily was 557 calories. By 2012, it had risen to 708 calories per day.33
People eat more processed foods.
While processed food has been a part of the American diet for more than 100 years, Americans are now eating more of it than ever before.
Processed foods now make up around 60% of all the food people eat.34
Americans eat less nutritious food as a whole.
- Americans consume 23% more calories per day than they were in 1970.35 A greater percentage of those calories are coming from fats, oils and sugars while fewer calories are coming from vegetables.
- In 1975, just 25% of the average American food budget went toward takeout.36 In 2017, that was up to 44%.37
- Cheese intake in America has more than doubled since 1979.38
“Western diets are higher in added sugars, salt and fat than they used to be, which we know contributes to the development of chronic conditions,” said Angela Stancil, a registered dietician from California.
Americans are sitting more often.
Sedentary jobs have increased 83% since 1950. Physically active jobs make up less than 20% of the workforce, down from roughly half of all jobs in 1960.39
Adults aren’t just sitting more while on the clock either. Non-working sitting time has increased by an hour per day for adults between 2007 and 2016.40
People spend more time in front of screens.
Adults are now spending nearly half (42%) of their waking hours looking at a screen.41
Television alone has accounted for an additional two hours per day per household since 1969, not to mention the computers, tablets and smartphones that have become such a part of everyday life in the most recent decades.42
Still, 77 percent of all respondents of our survey who reported exercising infrequently or never believed they were in either good, very good, or excellent health.
“There’s a tendency to underreport intake and weight gain that are perceived as being ‘bad’ and overestimate physical activity which is usually perceived as being ‘good.’ I see this often when I ask clients to tell me about how much they’ve eaten, recent weight changes, or how active they are,” said Stanccil.
“No one wants to be perceived as being lazy or ignorant, so they seek validation for their intentions. For example, a person may report going to the gym a few times a week knowing they’ve only been once for the month if their intention is to go more often moving forward.”
People sleep less.
U.S. adults were sawing logs for 7.38 hours per night in 1980, but that number dipped to 6.69 by 2013.43
It’s recommended that adults get at least seven hours per night, and the CDC estimates that more than one-third of Americans aren’t achieving that.44
Americans use more plastic.
Exposure to plastic has been linked to cancer, birth defects, impaired immunity, endocrine disruption and more. Plastic infiltrates drinking water and poisons the food chain.
Plastic began being manufactured at a large scale in the 1950s, and the rate at which it’s being used is accelerating: Half of the plastic that’s ever been produced has been made in the last 13 years alone.45
Adults spend more time driving.
The average commute to work has increased from 21.7 minutes in 198046 to 26.9 minutes in 2017.47
The added 10 minutes of roundtrip driving per day adds up to more than 40 additional hours per year. This also equates to more sitting, more stress and more exposure to traffic pollution.
Adults have more stress.
The U.S. recently ranked fourth out of 143 countries in a study of stress levels.48
American stress levels have shot up by as much as 30% over the past three decades.49
People soak up less Vitamin D.
American Vitamin D levels have dipped over the last 30 years. Vitamin D deficiency can lead to loss of bone density, depression, joint pain and even hair loss.50
Adults work longer hours.
The time adults spent working increased a whopping 11 hours per week between 1979 and 2006.51
More hours on the timesheet has been linked to obesity, heart disease, high blood pressure and even early death.
Americans are exposed to more chemicals.
While the true effect of chemical exposure as it relates to cancer is impossible to pinpoint, the World Health Organization (WHO) has estimated environmental toxic exposures to account for between 7-19% of human cancers.52
From weed killers to cleaning solutions to hygiene products, chemicals are a part of people’s everyday lives more than ever before.
People take too many antibiotics.
The CDC reports that one out of every three antibiotic prescriptions is unnecessary, which increases Americans’ resistance to the drugs and worsens the threat of deadly infections and disease.53
Conclusions
After gathering data from nearly 500 American adults, it’s evident that Americans are not being honest with themselves about their health.
They are more likely to overestimate their own health.
They are more likely to view their own health favorably when compared to the average American today.
They are more likely to view their own health favorably when compared to Americans of previous generations.
Methodology
This study was conducted in August 2019 using an online survey, via Amazon's Mechanical Turk. The total survey side included 500 participants (N=500). Participants were filtered to exclude heavy users of the Mechanical Turk platform, as well as based on completion time and failure to follow written instructions within the survey.
- Gender distribution: 43 % male, 57 % female
- Age distribution: 295 18-35, 205 35+
- Margin of Error: +/- 5 %
This survey relies on self-reported data.
Research Contact
Ryan Shevin: ryan@tzhealthmedia.com
Fair Use Statement
Of course we would love for you to share our work with others. We just ask that if you do, please grant us the proper citation with a link to this study so that we may be given credit for our efforts.
Resource guides
Our resource guides provide helpful information and assistance for a range of topics such as prescription drug costs, alcohol abuse, fall prevention, senior hunger and more.
Contributors
- Monique May, M.D., M.H.A., Family medicine physician, Charlotte, NC
- Angela Stancil, M.S., R.D., L.D.N., Registered dietitian, Los Angeles, CA
Resource guides
Our resource guides provide helpful information and assistance for a range of topics such as prescription drug costs, alcohol abuse, fall prevention, senior hunger and more.