
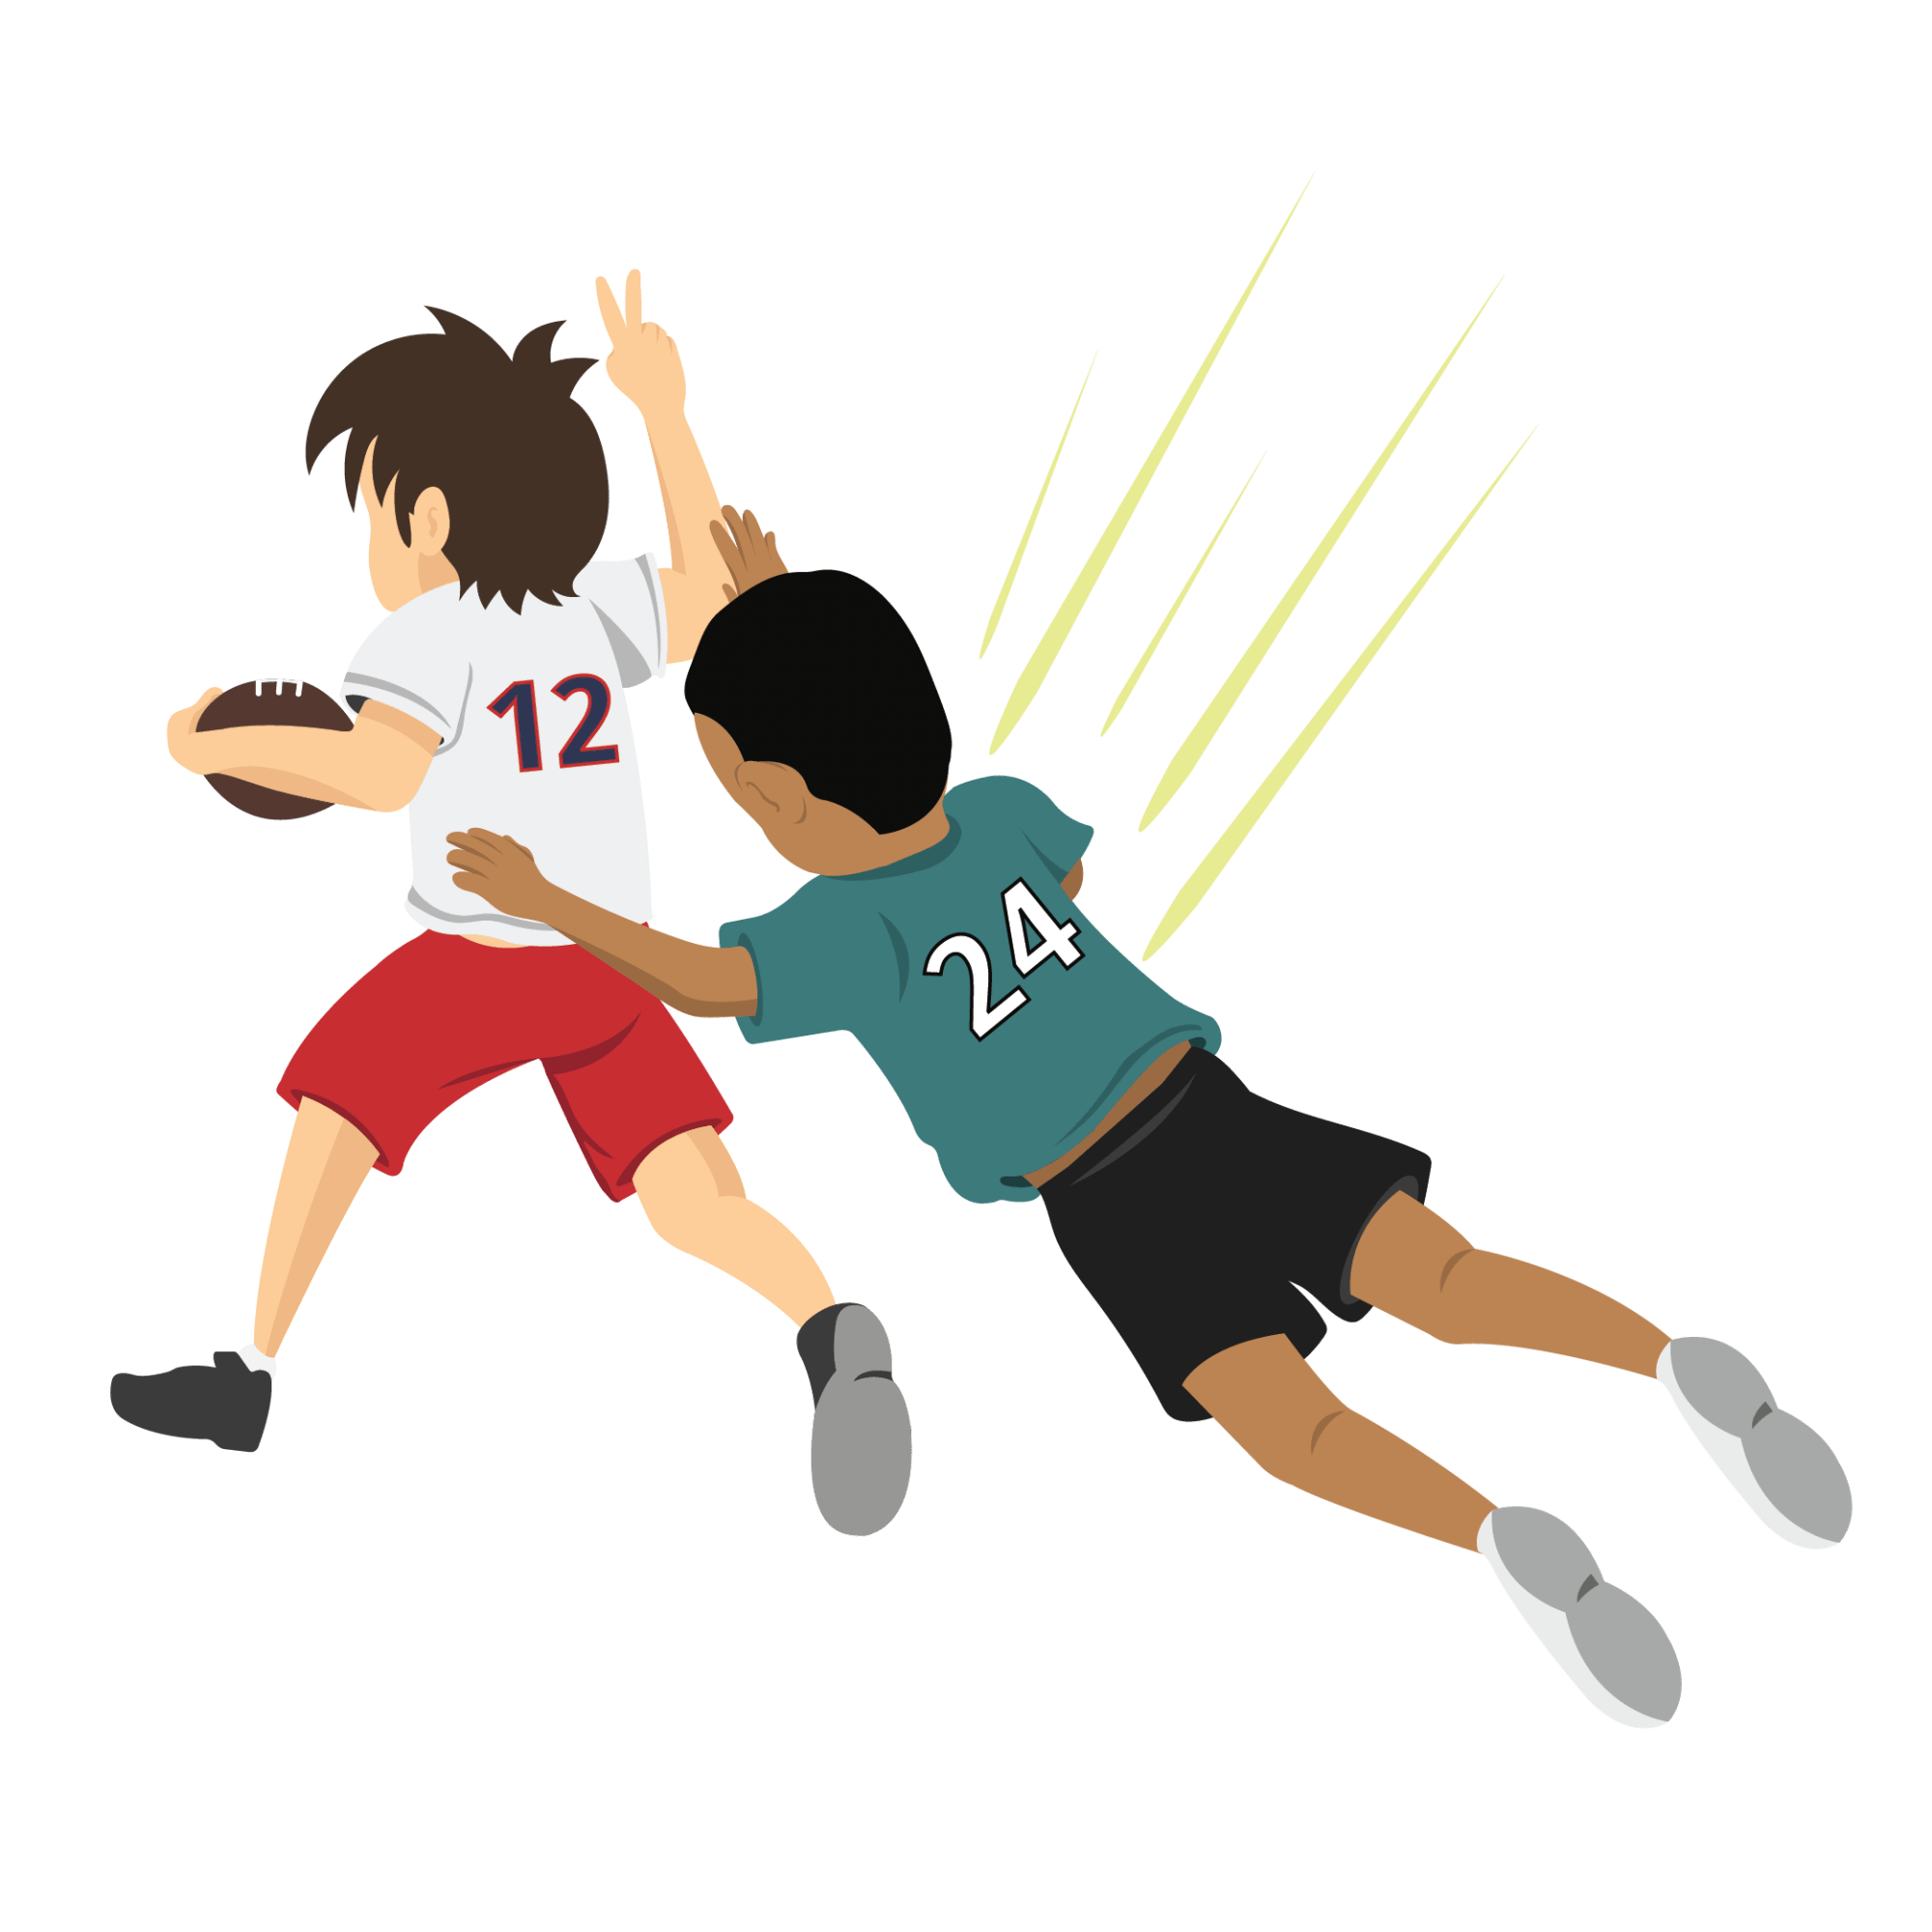
Super Dangerous: Common At-Home Injuries Fans Suffer During the Super Bowl
Study of the “Most Dangerous” Super Bowl Teams of the Past 20 Years
Published January 17, 2020
Super Bowl Sunday is a dangerous day. The night of the big game is known to see a spike in drunk driving accidents, and studies have shown an increase in cardiac deaths for fans of losing Super Bowl teams.
But what types of injuries do football fans face at home during the Super Bowl? And who has been the most dangerous Super Bowl team of the past 20 years?
We set out to discover just that.
We pored over emergency room data from the National Electronic Injury Surveillance System (NEISS, which is provided by the U.S. Consumer Product Safety Commission) and cardiac death data from the Centers for Disease Control and Prevention’s WONDER database to determine which team’s Super Bowl participation inspired the most household accidents and caused the highest increase in cardiac deaths.
We learned more than we expected, and our findings help illustrate the importance of safety, awareness and moderation for fans watching any major sporting event, especially when Super Bowl LIV kicks off in Miami on February 2, 2020.
Did You Know...
- Over the past 20 years, football fans were typically more likely to suffer a TV-related injury or a kitchen injury over Super Bowl weekend than during the average day that given year.
- For 15 of the 19 Super Bowls we studied, the rate of injuries sustained while playing football increased the day after the big game, suggesting that people are inspired by what they saw on TV the previous day and hurt themselves trying to recapture the glory.
- Numerous studies have shown a correlation between cardiac deaths and important sports events such as the Super Bowl and the World Cup.
TV-Related Injuries and Kitchen Injuries Increase on Super Bowl Sunday
Televisions are dropped, kicked and punched. Kitchen accidents spike. Cardiac arrest is more prevalent. Almost across the board, the incidence rate of injuries in the home on the day of the Super Bowl is higher than the daily average for the rest of the year.
In order to examine these trends further and to estimate the most dangerous Super Bowl teams of the past 20 years, we analyzed injuries that were coded in the NEISS database as being related to TVs and a number of common kitchen items.
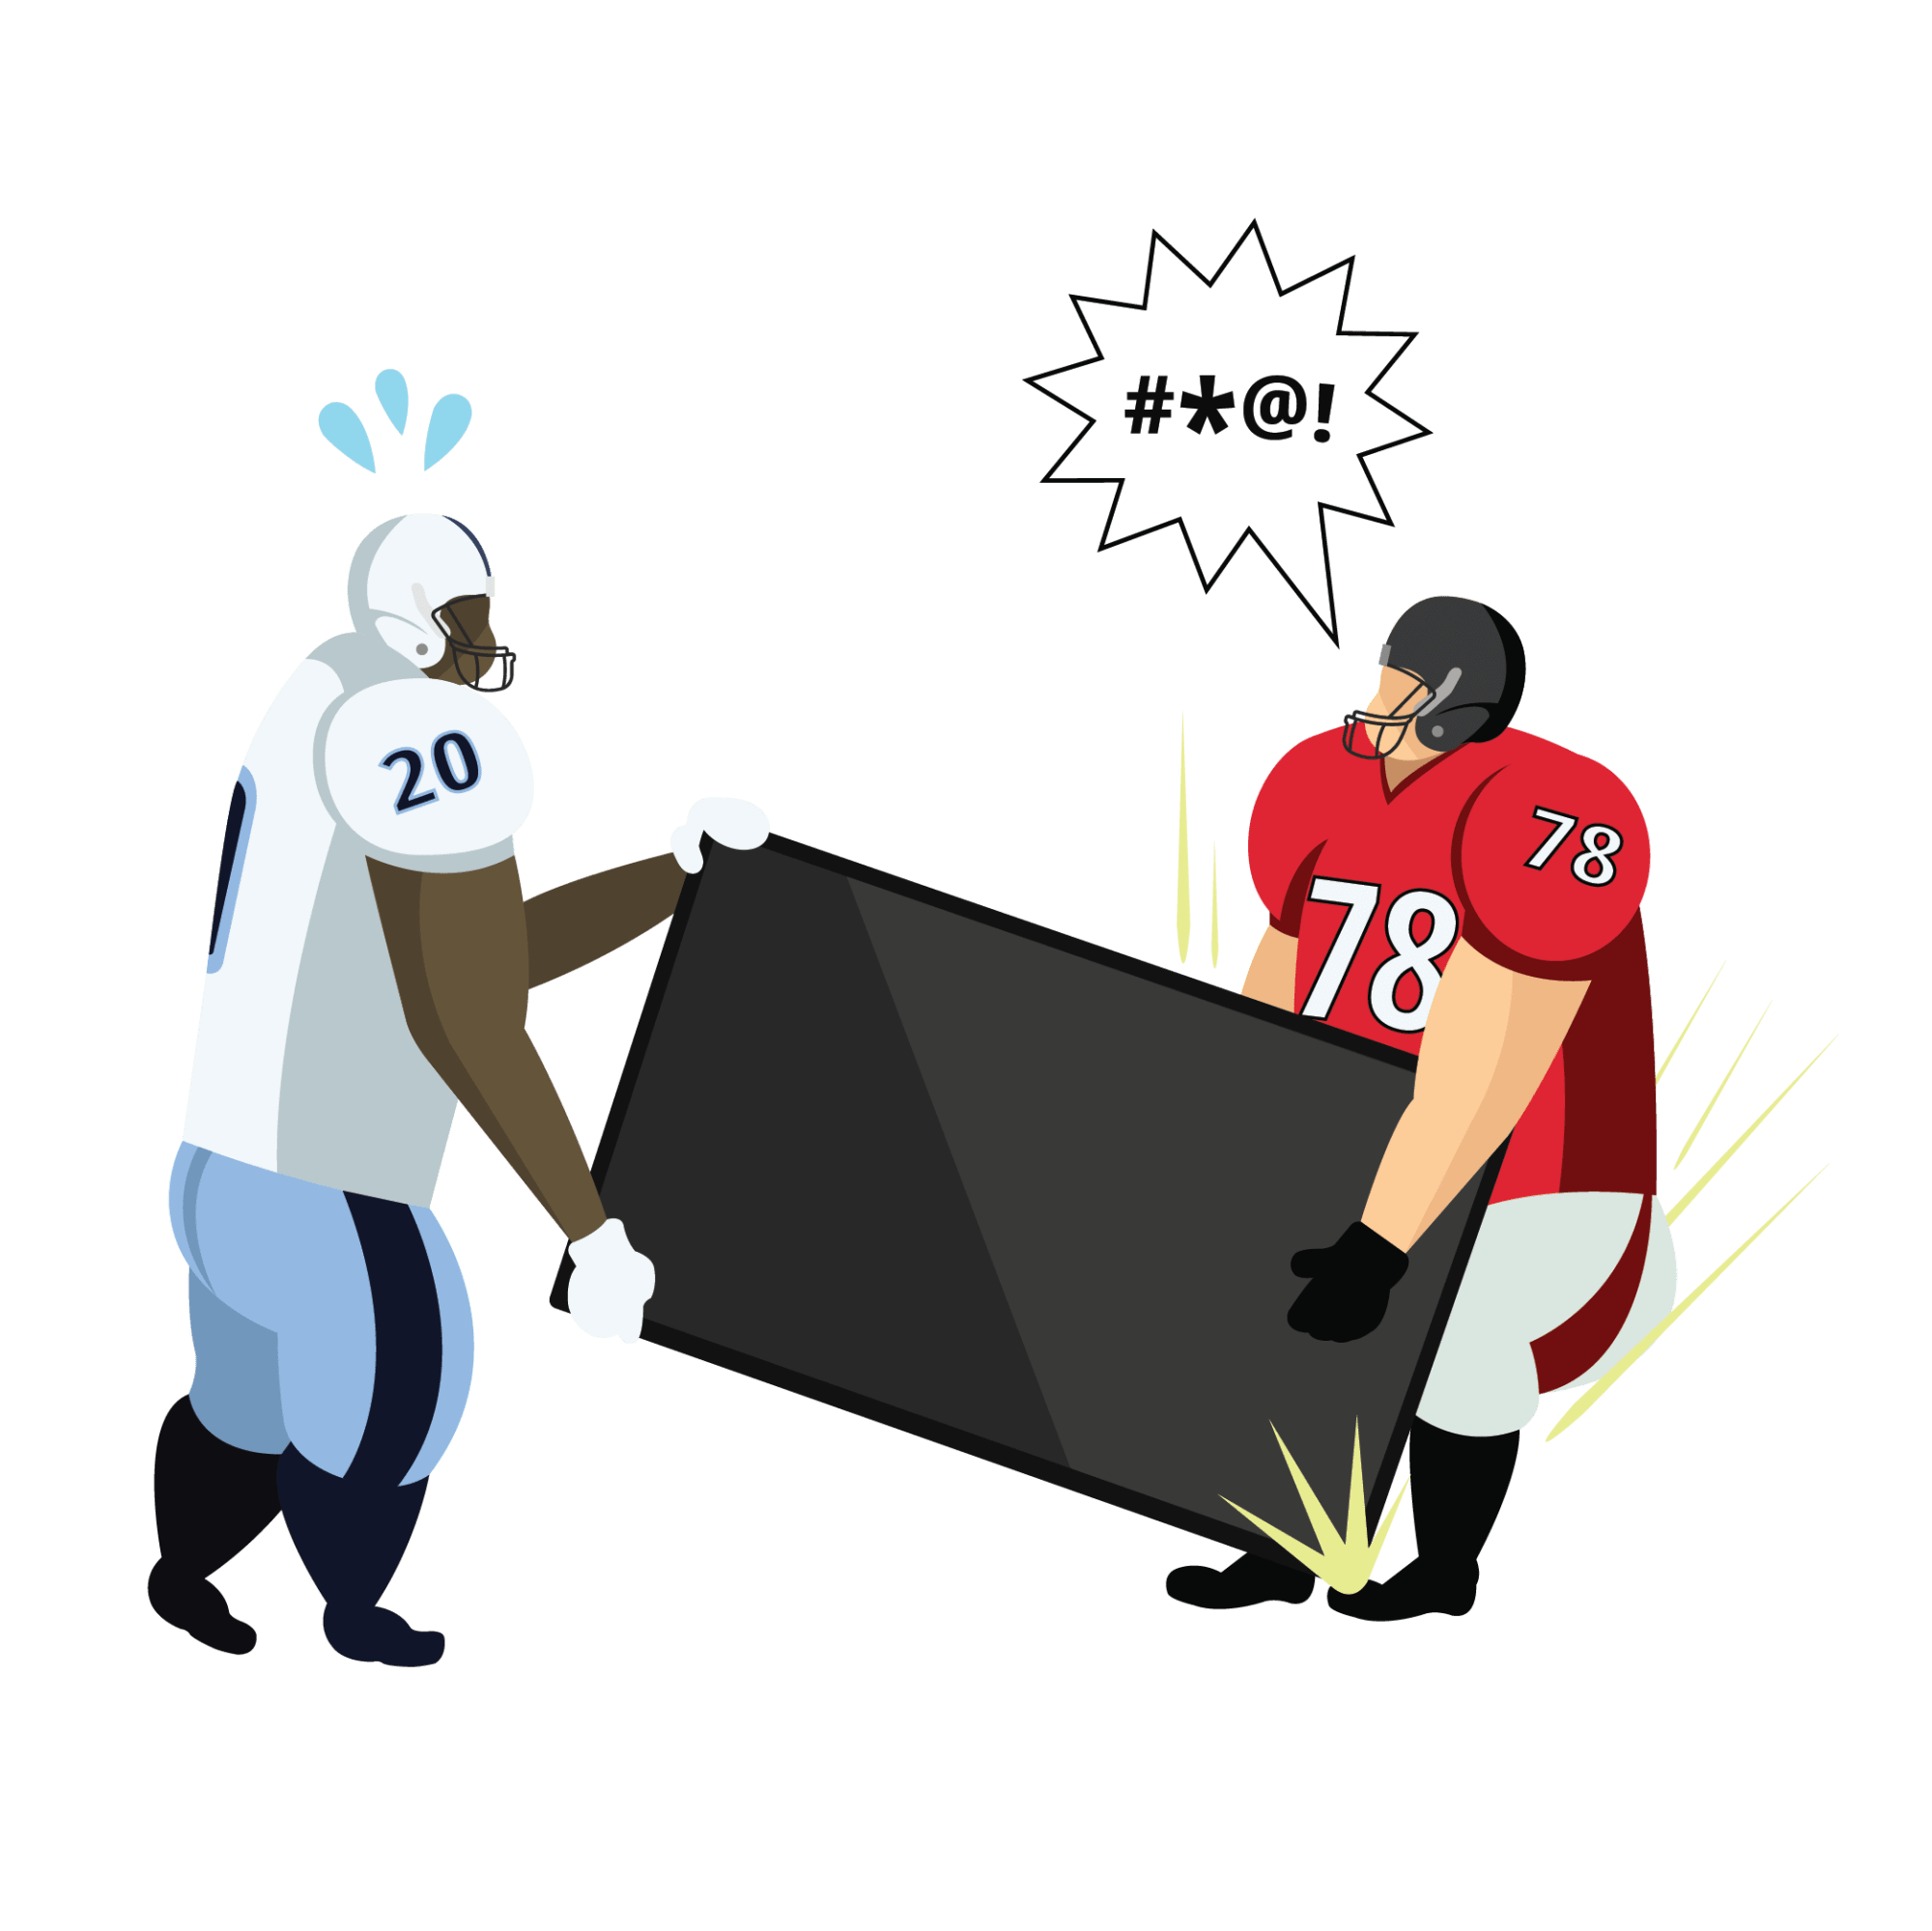
TV-Related Injuries
The TV-related injuries we studied include wounds suffered while striking a television out of anger or excitement, knocking it down, dropping it, pulling a muscle while moving it or any other injury that was caused by a television.
We found that on 15 of the 19 Super Bowl weekends we studied, people suffered these types of TV-related injuries at around the same or higher rate than the average for any other day that year.
For example, fans were twice as likely to hurt themselves by, say, dropping a TV on their toe the day of the 2004 Super Bowl between the New England Patriots and the New York Giants than on the average day that year.
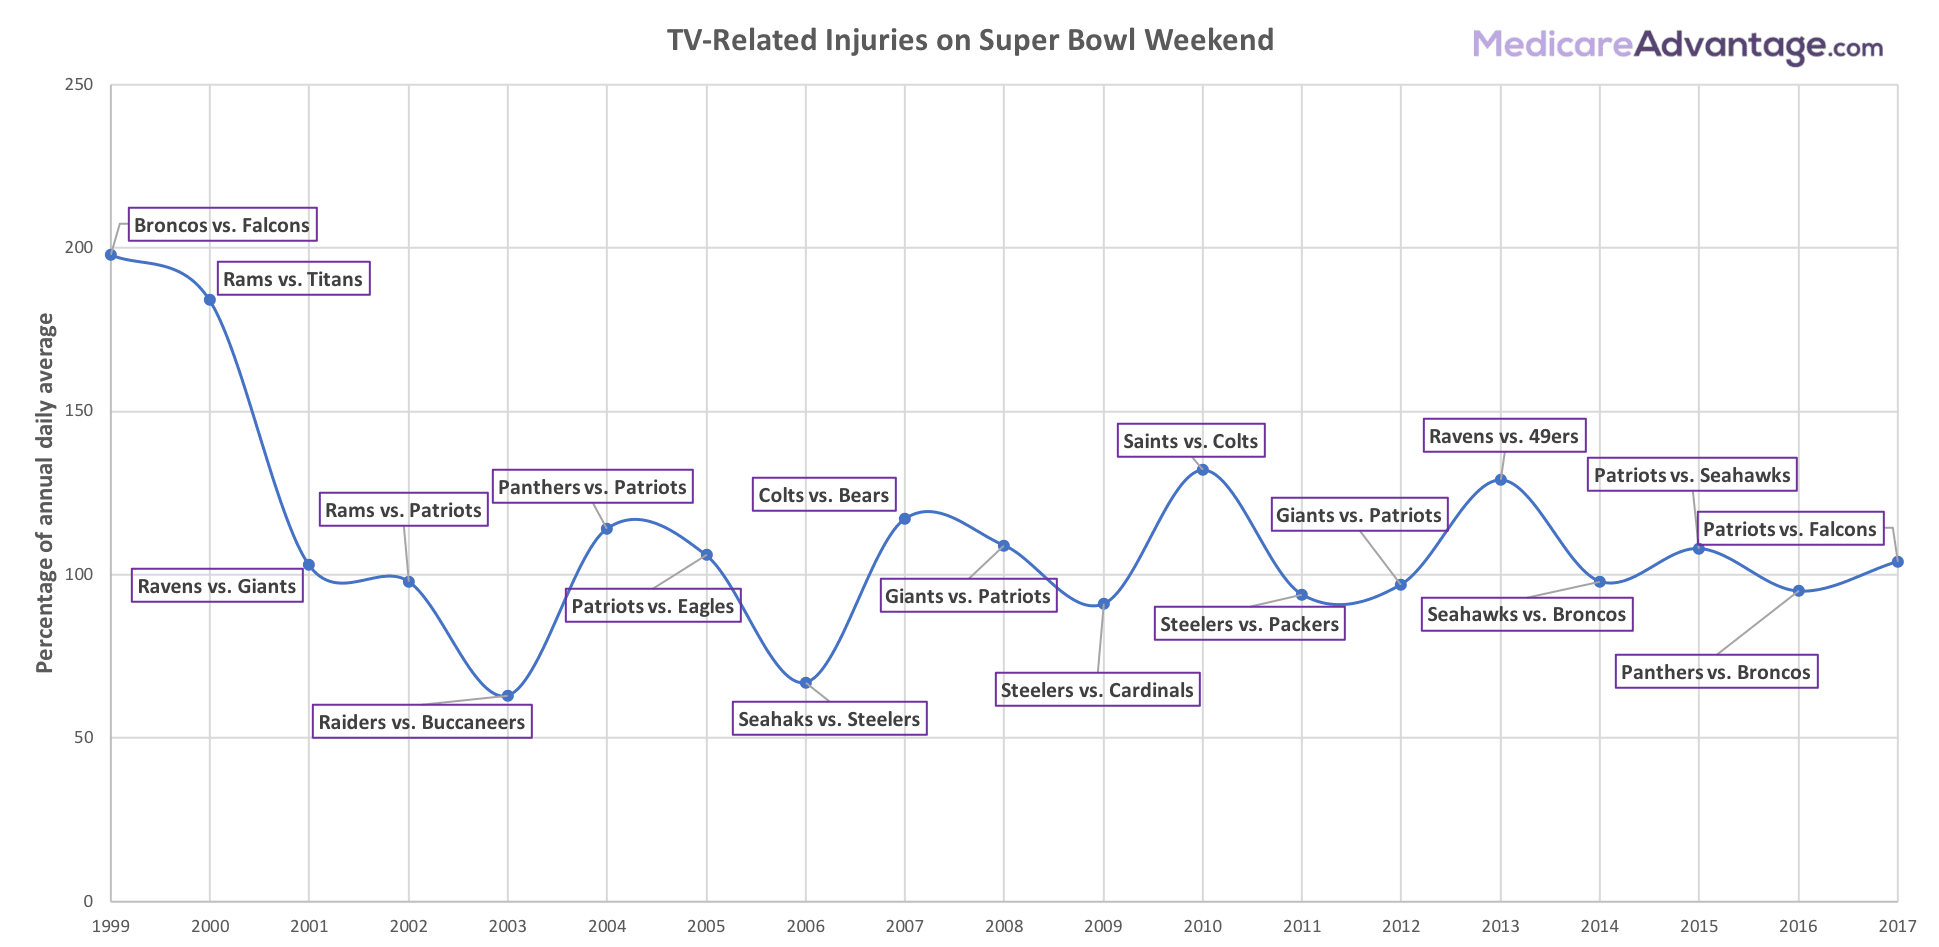
To view full-size chart, click here.
A discernible leveling off of the TV-related injuries trend is evident after coming down from the high rates seen in 1999 and 2000. One primary reason for this trend may be the growth in popularity of flat-screen TVs during the early 2000s.
This meant a gradual decline in the number of heavier CRT (or “tube”) TVs in favor of slimmer and lighter TVs that may cause fewer injuries when the TV is bumped or dropped.
Here are some interesting cases we found:
- In one incident, a 39-year-old man was treated at a hospital ER for a laceration on his arm after he punched his TV during the Carolina Panthers’ 2016 Super Bowl loss to the Denver Broncos.
And he wasn’t alone. Since 1999, there have been numerous reported cases of people punching their TV during the Super Bowl. The average age of these TV punchers? 35 years old! - During the 2013 Super Bowl where the Baltimore Ravens beat the San Francisco 49ers, a 40-year-old man got so excited that he jumped up in his living room, accidentally knocked over his TV and suffered a deep laceration on his leg when the TV fell over on him.
- One common TV-related injury suffered by fans is a muscle strain or sprain from moving a TV. On the day before the 2001 Super Bowl when the Ravens took on the Giants, a 21-year-old man pulled a muscle in his shoulder while moving his brand new TV into his house.
- In an interesting twist of fate, a 17-year-old male was injured the day before the 2013 Super Bowl after he fell while running from the police and carrying a (presumably stolen) TV. The TV landed on his hand, which required a trip to the ER...once police caught up with him.
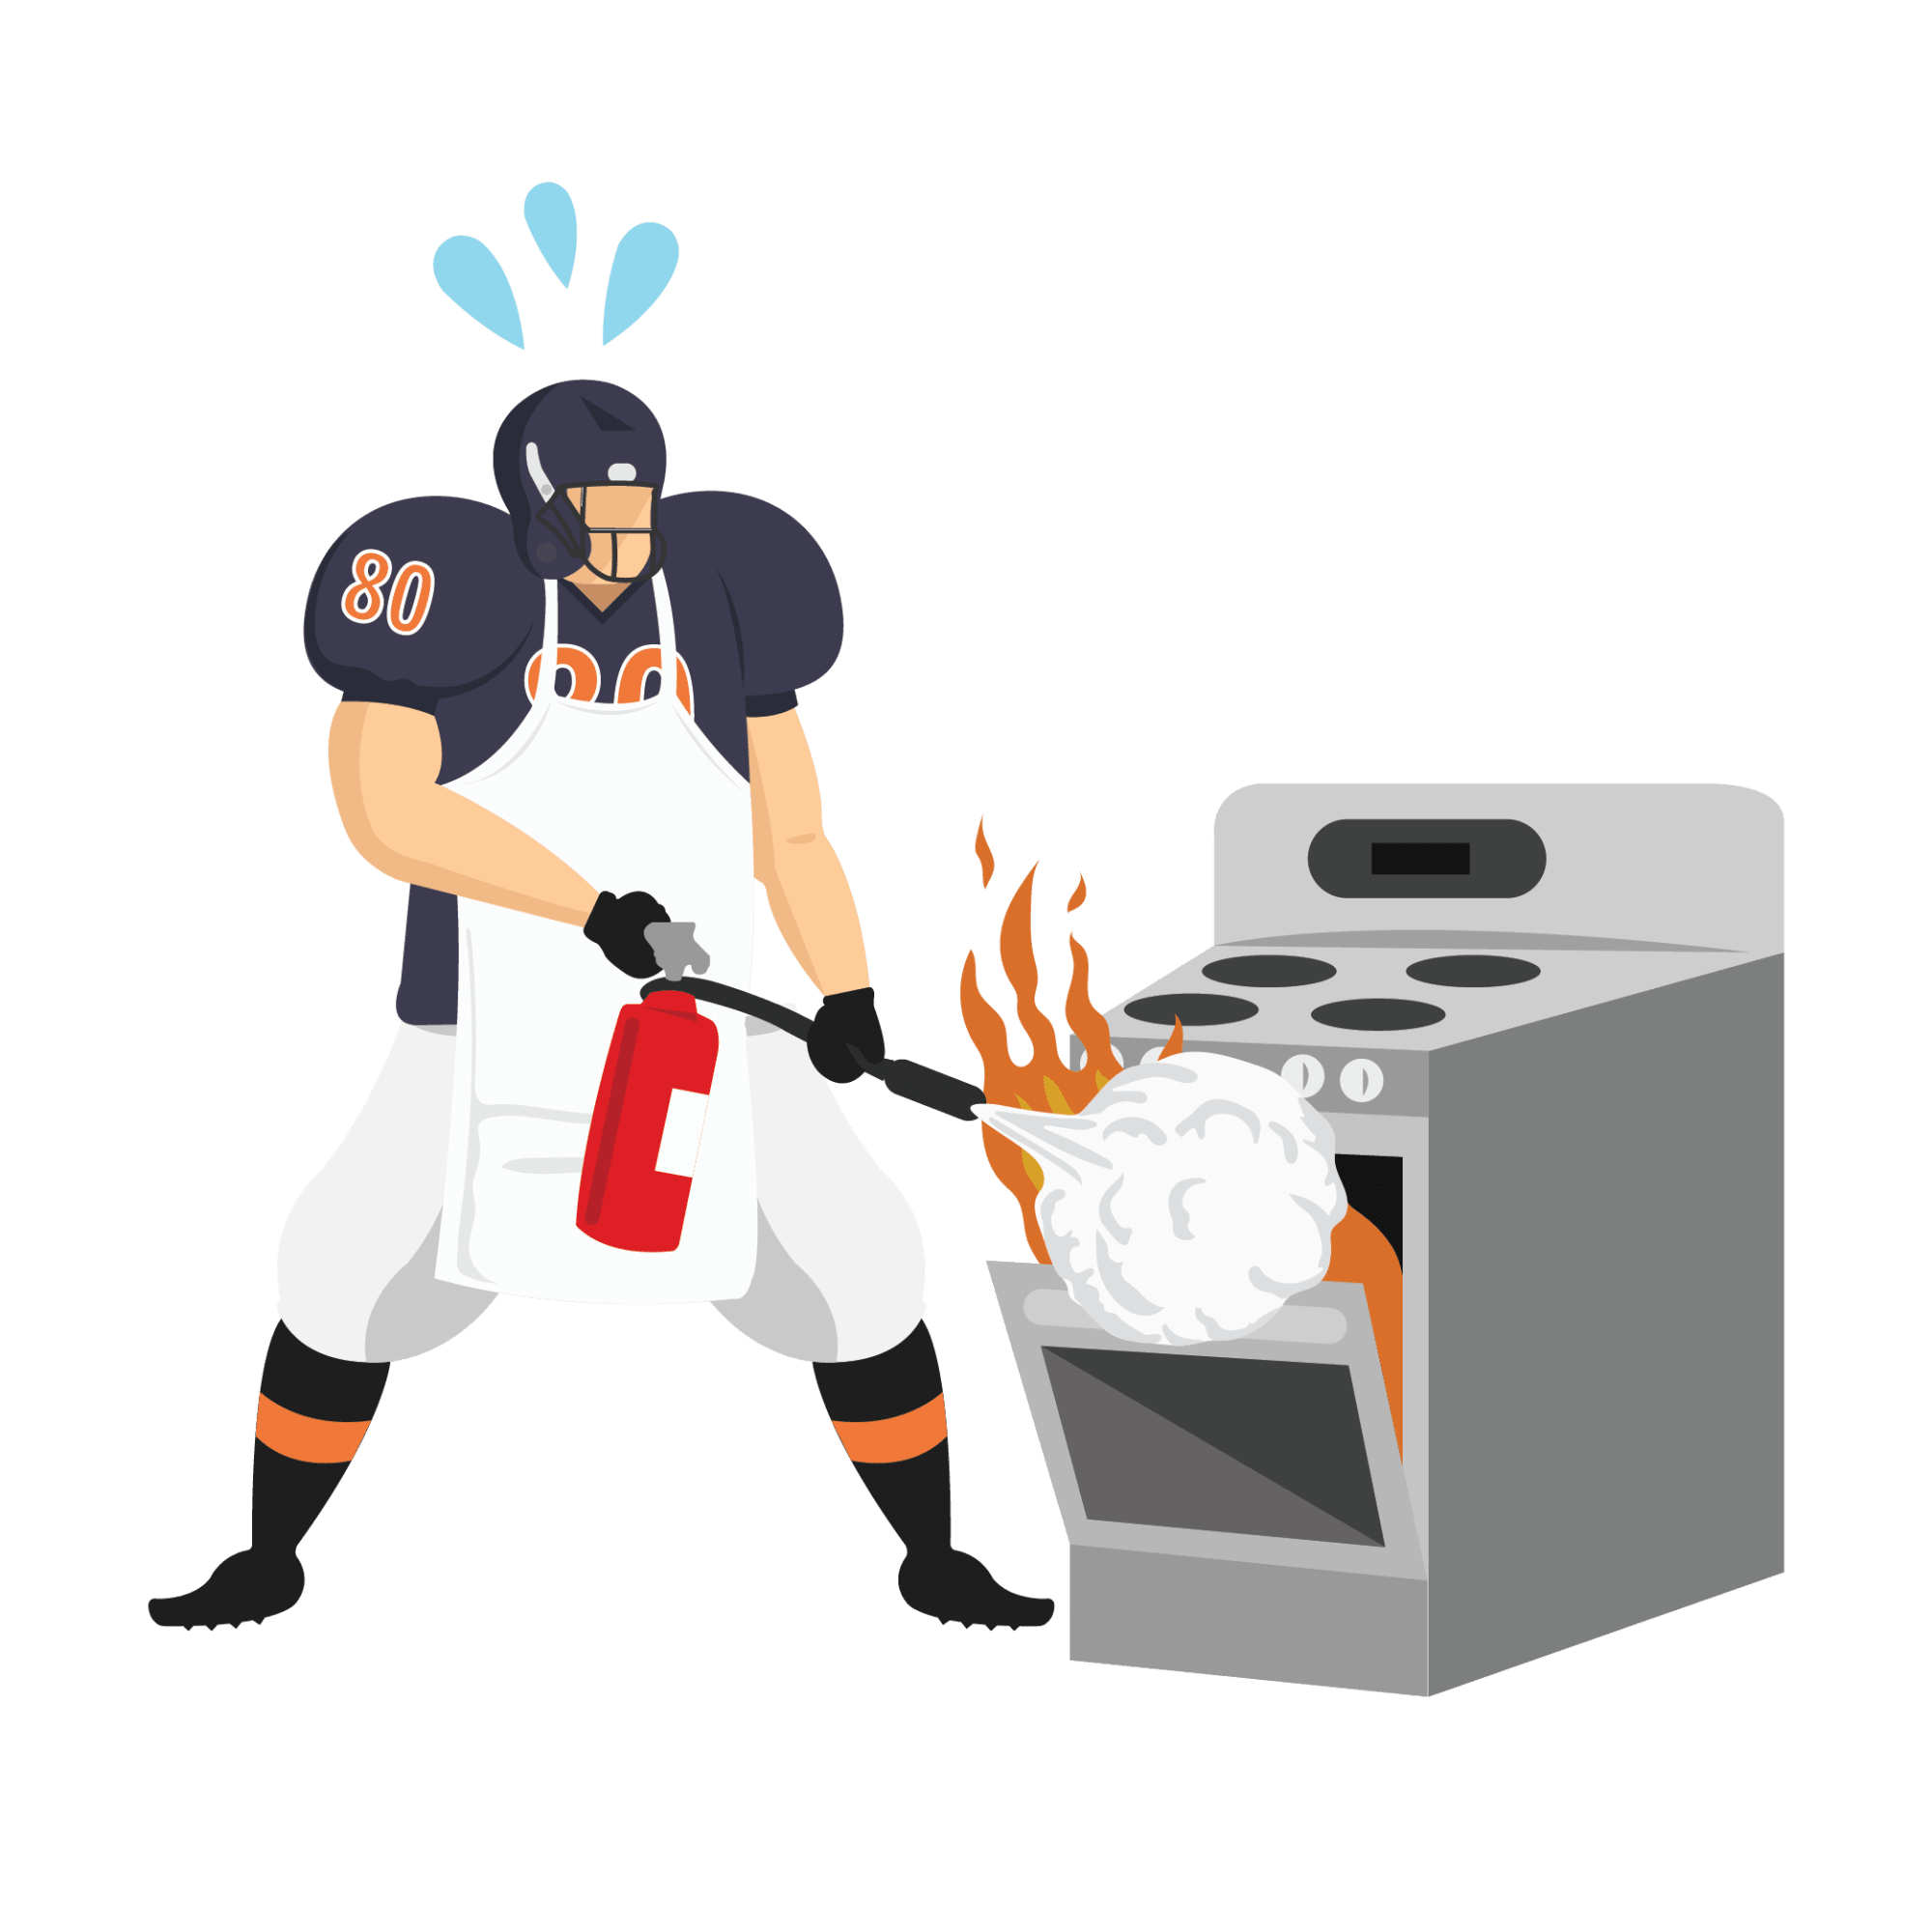
Kitchen-Related Injuries
Eating is an integral part of any Super Bowl party, and all that food prep has led to a number of injuries. These included burns, cuts, falls and several other causes for an emergency room trip that begins in the kitchen.
In order to validate some of our findings, we researched the levels of kitchen injuries on each Thanksgiving Day from 2013 to 2017.
We found that, similar to Super Bowl weekend, the number of kitchen injuries spike on Thanksgiving to levels that are well above the average rate for any other day in each given year. In fact, the rate of Thanksgiving kitchen accidents ranged anywhere from 221% to 371% of the daily average for the rest of the year.
It seems to go without saying that cooking boiling-hot cheese dips and cutting veggies for a sharable tray come with an increased risk of injuries, especially if the person cooking is distracted by the TV or visiting family and friends.
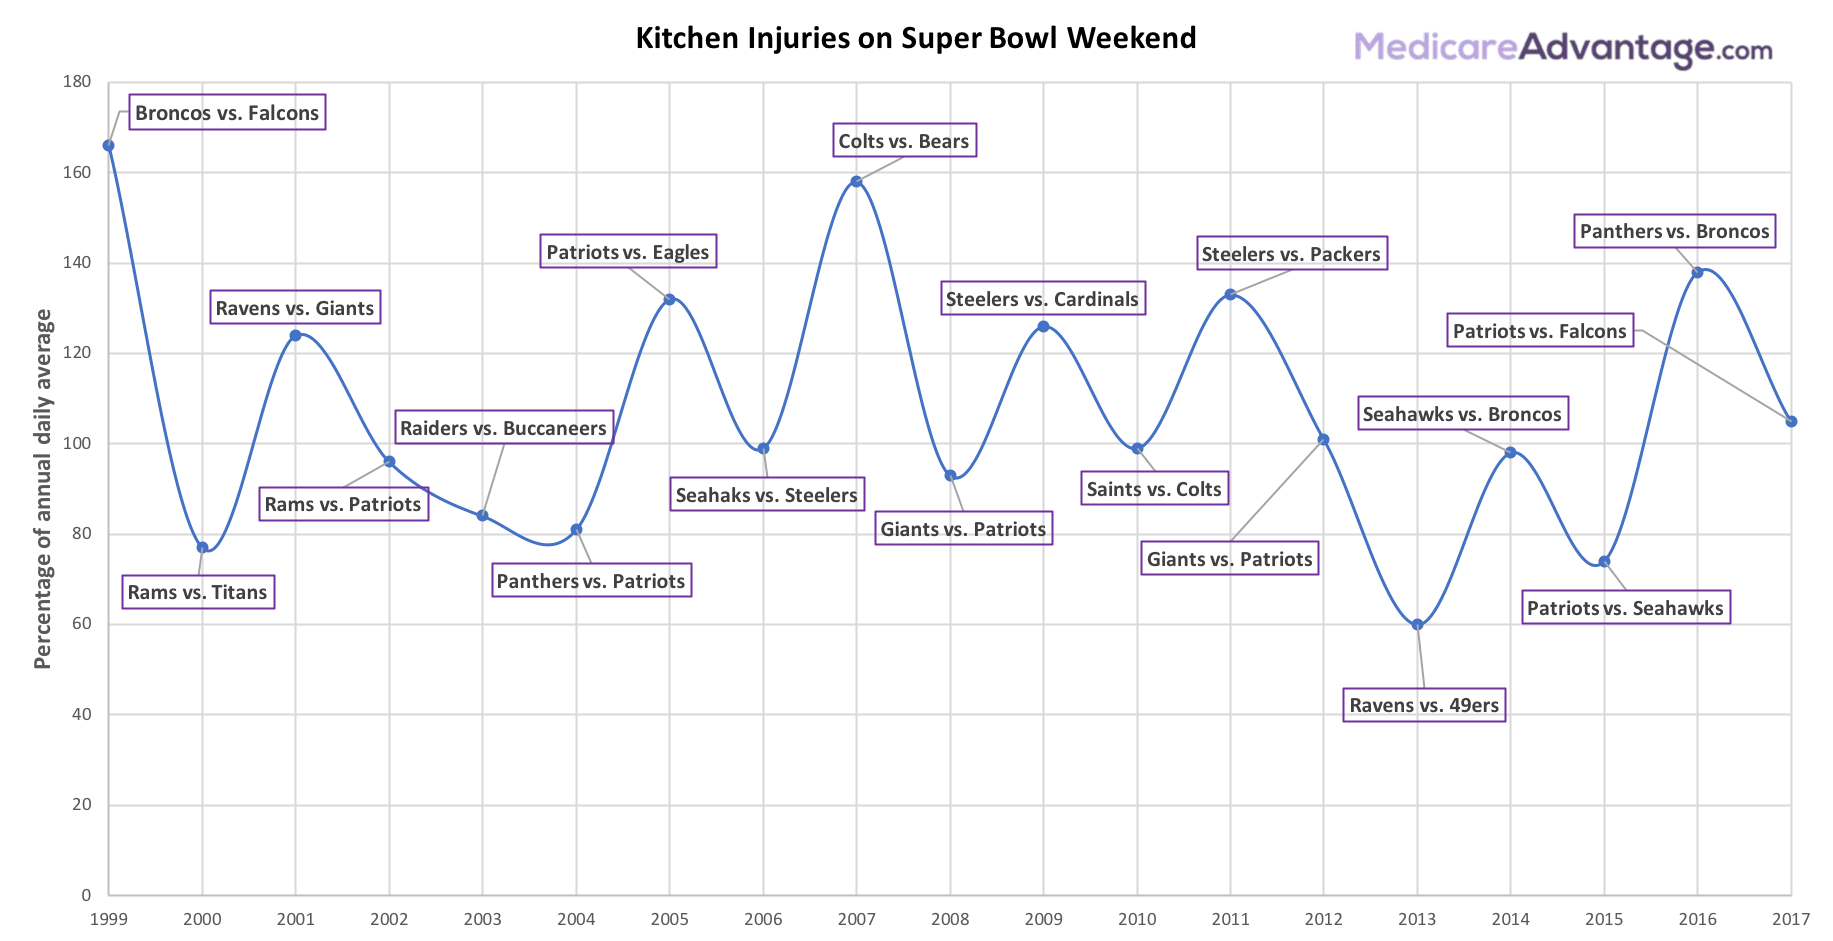
To view full-size chart, click here.
For 13 of the 19 Super Bowl weekends we studied, people suffered kitchen injuries at around the same or higher rate than the average for any other day that year. The average age of someone who suffered an injury in the kitchen during Super Bowl weekend was 34 years old.
Lacerations, burns and scaldings were the most common injuries suffered in the kitchen on Super Bowl weekend, making up 72% of all reported kitchen injuries during the Super Bowl weekends we studied.
Here are some interesting reported Super Bowl kitchen catastrophes:
- In 2004, while the Panthers lost to the Patriots, a 22-year-old male broke his foot after banging it against his stove while “dancing and drinking.”
- While the Patriots beat the Eagles in the 2005 Super Bowl, an 18-year-old male was treated for burns he suffered when grabbing hot nachos out of the microwave.
- Ovens and ranges were responsible for most of the injuries we found, but slicers/choppers, blenders and microwaves were also large contributors.
And the danger isn't just how people prepare snacks in the kitchen during Super Bowls, but what types of foods people are eating.
Watching the Super Bowl is often associated with excessive consumption of alcohol, fried foods, cheese and sugary treats. This dietary blitz can lead to big problems for even casual football fans, according to New Jersey State Epidemiologist Dr. Tina Tan.
“During Super Bowl events and even holidays, people might indulge in alcohol and diets high in sodium and sugar, which may cause issues for people who have health conditions like diabetes, heart or kidney disease, as there might be concerns related to swings in blood pressure and blood sugar levels, in addition to injuries associated with excessive alcohol use.” - Dr. Tina Tan, M.D., M.P.H.
More People Hurt Themselves Playing Football the Day After the Super Bowl
We also examined emergency room visits on Super Bowl weekend that resulted from playing football, whether it’s an organized game or a sandlot shootout. Seeing as how the Super Bowl is played out of season for most organized football leagues, many of the injuries in this category took place in backyard pickup games and on schoolyard playgrounds and gym classes.
The most interesting fact we found is that the number of football-related injuries almost always rose the day after the Super Bowl, sometimes by as much as 140%. Monday morning quarterbacking got football fans sent to the ER 12.3% more often than people who were treated on the day of the big game.
Some of the more interesting cases we found included:
- On the day that the Tampa Bay Buccaneers faced the Oakland Raiders in the 2003 Super Bowl, a backyard football game ended when a deep facial contusion was suffered by one of the players — a 73-year-old woman.
- While he wasn’t actually playing football, a 28-year-old man dislocated his shoulder while high-fiving his friend during the 2002 Super Bowl when the Patriots faced off against the Rams.
Research Shows a Link Between Important Games and Cardiac Deaths
While our study takes a focus on at-home and recreational accidents and their correlation to Super Bowl weekend, other studies have been conducted to explore the link between important sporting events like the Super Bowl and the cardiac death rates for fans of teams playing in those events.
In 2002 and 2008, researchers examined the rates of cardiac deaths and acute cardiovascular events for fans of the England national team and German national team, respectively, when each team played in the World Cup.
- Researchers from the University of Birmingham and the University of Bristol found the rate of ER admission for a heart attack in English hospitals increased by 25% on the day England lost to Argentina in the 1998 World Cup. This increase continued for the following two days.
This particular game ended in dramatic fashion, with Argentina beating England in a penalty kick shootout. - Researchers from Ludwig Maximilian University of Munich demonstrated that German football (soccer) fans were suffering coronary emergencies at a much higher rate than normal when the German national team was playing a match in the World Cup.
In fact, coronary emergencies such as heart attacks more than doubled the normal rate during any period that the German national team was playing.
Similarly, two American studies were done in 2009 and 2013 to find out just how much of an impact the Super Bowl can have on the heart health of diehard fans.
- When the L.A. Rams lost the 1980 Super Bowl to the Pittsburgh Steelers, the rate of cardiac deaths increased noticeably in Los Angeles County for the following fourteen days, according to researchers from Good Samaritan Hospital in L.A., the University of New Mexico and RTI International.
When the L.A. Raiders beat the Washington Redskins in the 1984 Super Bowl, however, the rate of cardiac deaths (and all other deaths, for that matter) fell below the average for the following two weeks. - Some of the same team of researchers later examined two more recent Super Bowls. They found that circulatory deaths and heart disease deaths in Massachusetts increased by more than 20% during the week that followed the New England Patriots’ 2008 Super Bowl loss to the New York Giants.
The game was notable as an upset loss for the Patriots, and one that was decided in dramatic fashion late in the game.
The researchers found, in contrast, heart disease deaths and heart attack deaths in Pittsburgh both decreased dramatically during the week after the Steelers’ 2009 Super Bowl victory over the Arizona Cardinals.
This game, too, was won in dramatic fashion when the Steelers scored the game-winning touchdown with only 35 seconds left in regulation.
These similar studies seem to indicate a correlation between fandom, important games and heart health.
When “everything” (such as a world championship title) is on the line, the most devoted fans of a team are likely to be not only invested in the outcome, but their lives may actually depend on a positive outcome.
“There's a recurring pattern that a sporting event can increase cardiac events and death rates when some conditions are met: when the fans are of the losing team, when the game is played at home, particularly when the losing team was expected to win, especially in a game that goes into overtime or has a shoot-out.” - Dr. Bryan Schwartz, M.D.1
Sharing the Flu at Super Bowl Parties
Researchers from the Tulane University School of Public Health combed through Vital Statistics of the U.S. from 1974 to 2002, and they found a correlation between counties that have a local NFL team in the Super Bowl and an uptick in influenza deaths for people over age 65.
According to Dr. Charles Stoecker and his research team, deaths caused by the flu increased 18% for people over age 65 when their local team played in the Super Bowl. They found no increase in influenza deaths in the cities that hosted Super Bowls, however, which suggests the biggest culprit for spreading the flu is at-home Super Bowl watching parties.
“It's people that are staying at home and hosting small local gatherings, so your Super Bowl party, that are actually passing influenza among themselves.” - Dr. Charles Stoecker, Ph.D, M.A.2
According to the report, older adults would be well-served to do everything they can to keep their Super Bowl parties clean and sanitary. That means washing your hands regularly and not sharing a common bowl of dip – but if you do, no double-dipping!
The Most Dangerous Super Bowl Teams of the Past 20 Years
Using all of the injury data and cardiac death statistics we collected, we ranked each of the 19 Super Bowl teams that played in the big game from 1999 to 2017 (the period that corresponds to the most recent available data).
We assigned each team a “Danger Factor” based on the rates of at-home injuries and cardiac deaths that occurred around each of their Super Bowl appearances. And what did we find?
Topping our list of the most dangerous Super Bowl teams in the past 20 years was the Tennessee Titans, with the Atlanta Falcons, Denver Broncos, Los Angeles (formerly St. Louis) Rams and Philadelphia Eagles rounding out the top five.
How did each team earn their place in our ranking? Take a look at each team’s Danger Highlights below our ranking list to learn more.
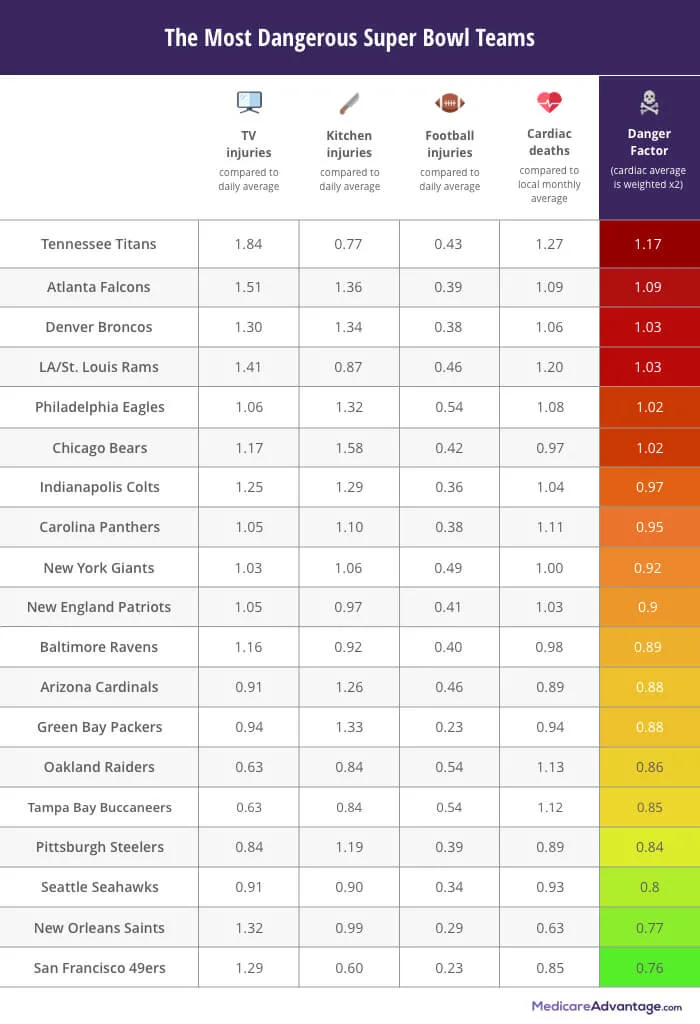
For the full methodology, see Methodology section.
1. Tennessee Titans
Appearances: 1 (2000)
Danger Factor: 1.17
The Aftermath:
TV-related injuries = 184% of the national daily national average
Kitchen-related injuries = 77% of the national daily national average
Football-related injuries = 43% of the national daily national average
Cardiac deaths = 127% the average rate for February in Davidson County (home of the Titans)
The Tennessee Titans made only one Super Bowl appearance, but it was a memorable one. Most people remember it for “The Tackle,” when Tennessee’s Kevin Dyson was brought down on the one-yard line on the last play of the game for what could have been the game-tying score.
It’s hard to imagine a more agonizing Super Bowl loss for any football fan, and the numbers reflect the heartache. Cardiac deaths for Titans fans were 27% higher in February 1999 than the average rate, which lands them at the top of our list.
2. Atlanta Falcons
Appearances: 2 (1999, 2017)
Danger Factor: 1.09
The Aftermath:
TV-related injuries = 151%
Kitchen-related injuries = 136%
Football-related injuries = 39%
Cardiac deaths = 109%
Atlanta’s two Super Bowl appearances have been difficult for Falcons fans. In 1999, the team fell behind 31-6 in the fourth quarter on their way to a lopsided defeat against the Broncos, 34-19. And in 2017, the Falcons famously botched a 28-3 second-half lead en route to a loss to the Patriots.
The Falcons Super Bowl appearances accounted for the second-highest increases in TV-related injuries and kitchen injuries of any team we studied, which could suggest that distractions and emotional turmoil may have negatively affected Atlanta fans.
3. Denver Broncos
Appearances: 3 (1999, 2014, 2016)
Danger Factor: 1.03
The Aftermath:
TV-related injuries = 130%
Kitchen-related injuries = 134%
Football-related injuries = 38%
Cardiac deaths = 106%
Much of the destruction on Denver’s tally sheet comes from their 1999 Super Bowl appearance, which proved to be the most dangerous Super Bowl during our study period. During that Super Bowl weekend, the rates of kitchen injuries, TV-related injuries and cardiac deaths were all above the average rate.
The 1999 matchup was John Elway’s final game as the Bronco’s quarterback. Was the uptick in home accidents and cardiac deaths partially a result of the distraction and heartbreak of his farewell game?
4. Los Angeles (formerly St. Louis) Rams
Appearances: 2 (2000, 2002)
Danger Factor: 1.03
The Aftermath:
TV-related injuries = 141%
Kitchen-related injuries = 87%
Football-related injuries = 46%
Cardiac deaths = 120%
Whether they are representing St. Louis or L.A., the Rams‘ Super Bowl appearances have spurred the third-highest rate of TV-related injuries, the fifth-highest rate of football-playing injuries and the second-highest rate of cardiac deaths.
When it comes to Super Bowl party fouls over the past 20 years, the Rams knew no boundaries.
5. Philadelphia Eagles
Appearances: 1 (2005)
Danger Factor: 1.02
The Aftermath:
TV-related injuries = 106%
Kitchen-related injuries = 132%
Football-related injuries = 54%
Cardiac deaths = 108%
It may come as little surprise that a team with such a … “passionate” fan base ranked so high on our Danger Factor list. After all, it was Eagles fans who famously booed and threw snowballs at Santa Claus.
So when the “Iggles” lost to the polarizing Patriots, the chaos was imminent. And in sticking right to the script for rough-and-tumble Philly fans, they led all teams in injuries stemming from backyard football battles.
6. Chicago Bears
Appearances: 1 (2007)
Danger Factor: 1.02
The Aftermath:
TV-related injuries = 117%
Kitchen-related injuries = 158%
Football-related injuries = 42%
Cardiac deaths = 97%
Da Bears’ lone Super Bowl appearance during our study period came in 2007, when they lost to the Colts 29-17. While Chicago didn’t do much damage on the field that day (they scored just one offensive touchdown), there was plenty of carnage happening elsewhere.
The Bears’ appearance registered the largest increase in kitchen-related accidents of any Super Bowl team, which is fitting for a city with such a rich culinary scene (their opponents, the Colts, appeared again in the 2010 Super Bowl, which brought down their overall kitchen injury average).
7. Indianapolis Colts
Appearances: 2 (2007, 2010)
Danger Factor: 0.97
The Aftermath:
TV-related injuries = 125%
Kitchen-related injuries = 129%
Football-related injuries = 36%
Cardiac deaths = 104%
As mentioned above, the Colts’ 2007 matchup against the Bears saw the biggest spike in kitchen-related accidents of any year. Their 2010 Super Bowl appearance produced the third-highest increase in TV-related injuries. Did this spike have anything to do with the Saints’ surprise onside kick trick play to start the second half (which was the turning point of the game)? Perhaps.
Indianapolis finished near the bottom in football-related injuries, however, and in the middle of the pack for cardiac deaths.
8. Carolina Panthers
Appearances: 2 (2004, 2016)
Danger Factor: 0.95
The Aftermath:
TV-related injuries = 105%
Kitchen-related injuries = 110%
Football-related injuries = 38%
Cardiac deaths = 111%
The Panthers have had a rough go of it in their two Super Bowl appearances. Panther’s fans may have suffered lots of heartache when Patriots kicker Adam Vinatieri hit the game-winning field goal with four seconds left in the 2004 Super Bowl (which sports writer Peter King called “the Greatest Super Bowl of all time”).
Or perhaps the increase in cardiac deaths had something to do with the heart-stopping halftime show, made infamous by Janet Jackson’s “wardrobe malfunction.”
When the Panthers met the Broncos in the 2016 Super Bowl, it was the third most-watched program in television history at the time. That may partly explain why the injury rate for backyard football games was on the low end compared to other Super Bowls.
But TV-related injuries and cardiac deaths were both up in 2016, which could be attributed to either Cam Newton’s late-game fumble or Coldplay’s halftime performance.
9. New York Giants
Appearances: 3 (2001, 2008, 2012)
Danger Factor: 0.92
The Aftermath:
TV-related injuries = 103%
Kitchen-related injuries = 106%
Football-related injuries = 49%
Cardiac deaths = 100%
The Giants lost to the Ravens in 2001, but they pulled off a pair of upsets over the mighty Patriots in their Super Bowl appearances in 2008 and 2012.
Those winning performances may have inspired some fans of the G-Men to get out on the gridiron of their own backyards, because the Giants lay claim to the fourth-highest rate of emergency room trips resulting from playing football.
Their 2012 victory over the Patriots was also notable for several reasons, including Ahmad Bradshaw scoring the come-from-behind game-winning touchdown with only 57 seconds left in the game and the fact that it was the second Giants victory over the Patriots that season.
Perhaps both of these factors contributed to the second-lowest rate of cardiac deaths for fans of any Super Bowl team since 1999.
10. New England Patriots
Appearances: 7 (2002, 2004, 2005, 2008, 2012, 2015, 2017)
Danger Factor: 0.90
The Aftermath:
TV-related injuries = 105%
Kitchen-related injuries = 97%
Football-related injuries = 41%
Cardiac deaths = 103%
New England’s Super Bowl record during our study period is nothing short of impressive: 7 Super Bowl appearances and five total wins with back-to-back wins in 2004 and 2005.
The Patriots have spent two decades re-writing the record books both on the field, but their per-game injury and cardiac death rates tended to stay close to the respective averages.
Our cardiac death analysis for Patriots fans applies to the population living in Suffolk County, where Boston is located. When researchers from Good Samaritan Hospital in Los Angeles and RTI International expanded their studies to focus on the entire population of Massachusetts, however, they found that ischemic heart disease (also called coronary artery disease) deaths in the state increased by 24% when the Patriots lost to the Giants in an upset for the 2008 Super Bowl.
11. Baltimore Ravens
Appearances: 2 (2001, 2013)
Danger Factor: 0.89
The Aftermath:
TV-related injuries = 116%
Kitchen-related injuries = 92%
Football-related injuries = 40%
Cardiac deaths = 98%
Perhaps the most dangerous incident related to the Ravens and the Super Bowl did not even involve a Super Bowl in which they played. In 2000, Ravens star linebacker Ray Lewis was leaving a Super Bowl party in Atlanta when the group he was with was involved in a fight that left two men dead.
Lewis was eventually cleared of the charge of murder. He was free to play in the big game for Baltimore the very next season and won Super Bowl MVP in their win over the Giants.
For the two Super Bowls in which the Ravens have played, things have remained relatively calm for fans, with kitchen injury rates and cardiac death rates that are slightly lower than the average.
12. Arizona Cardinals
Appearances: 1 (2009)
Danger Factor: 0.88
The Aftermath:
TV-related injuries = 91%
Kitchen-related injuries = 126%
Football-related injuries = 46%
Cardiac deaths = 89%
Arizona’s lone Super Bowl appearance came in 2009, in a game that was dubbed “The Recession Bowl” amid the ongoing recession that hit the U.S. economy at the time.
The rate of TV-related injuries for the 2009 game was the third-lowest of any we studied. Perhaps the number of TV-related injuries was affected by the recession, with fewer people buying new TVs before the big game.
It’s interesting to note that while cardiovascular death rates fell in Pittsburgh after the Steelers beat the Cardinals in the Super Bowl (according to the above-mentioned study from researchers at Good Samaritan Hospital in Los Angeles), the rate of heart-related deaths in Arizona didn’t change. The researchers concluded that fans from Pittsburgh “show stronger support for their home teams compared with Arizona”.
13. Green Bay Packers
Appearance: 1 (2011)
Danger Factor: 0.88
The Aftermath:
TV-related injuries = 94%
Kitchen-related injuries = 133%
Football-related injuries = 23%
Cardiac deaths = 94%
The Packers’ appearance in Super Bowl XLV inspired a considerable spike in the number of kitchen-related accidents from Cheeseheads around the country. But all told, the 2011 Super Bowl proved to be relatively safe for fans at home.
Most of the damage was done by Christina Aguilera, who botched the lyrics to the national anthem before the game.
14. Oakland Raiders
Appearance: 1 (2003)
Danger Factor: 0.86
The Aftermath:
TV-related injuries = 63%
Kitchen-related = 84%
Football-related = 54%
Cardiac deaths = 113%
The Raiders entered Super Bowl XXXVII in 2003 as a four-point favorite, but they ended up losing by 27 points, the seventh-largest margin of defeat in Super Bowl history. Perhaps this could help explain an uptick in cardiac deaths in the Bay Area in the weeks following the game.
15. Tampa Bay Buccaneers
Appearance: 1 (2003)
Danger Factor: 0.85
The Aftermath:
TV-related injuries = 63%
Kitchen-related injuries = 84%
Football-related injuries = 54%
Cardiac deaths = 112%
It’s no surprise that Tampa Bay ranks directly behind Oakland, as each team’s lone Super Bowl appearance during this period came on the same day.
Of note is that the Raiders-Bucs Super Bowl was the first to be aired in high definition, and the game resulted in the lowest rate of TV-related injuries. Maybe people think twice about punching the screen when it’s in high def.
16. Pittsburgh Steelers
Appearances: 3 (2006, 2009, 2011)
Danger Factor: 0.84
The Aftermath:
TV-related injuries = 84%
Kitchen-related injuries = 119%
Football-related injuries = 39%
Cardiac deaths = 89%
The Steelers crashed three Super Bowls in a span of six years. With TV-related and football-related injuries along with cardiac deaths all tracking below the daily averages, the Steelers have proved to be a family-friendly Super Bowl watch.
In fact, as mentioned above, researchers found that the Steelers’ 2009 victory over the Cardinals resulted in 46% fewer heart attacks in Pittsburgh for the two weeks following the big game.
17. Seattle Seahawks
Appearances: 3 (2006, 2014, 2015)
Danger Factor: 0.80
The Aftermath:
TV-related injuries = 91%
Kitchen-related injuries = 90%
Football-related injuries = 34%
Cardiac deaths = 93%
The Seahawks have played three rather safe Super Bowls against three different opponents, making themselves a common denominator for fan health friendliness.
Seattle was the only team to register a below-average rate for all four categories we measured. The only thing keeping them from ranking lower on our list was the relatively higher rate of cardiac deaths for their fans compared to the final two teams on our list.
It turns out that coffee, rain and grunge music might not be so hazardous to your health.
18. New Orleans Saints
Appearances: 1 (2010)
Danger Factor: 0.77
The Aftermath:
TV-related injuries = 132%
Kitchen-related injuries = 99%
Football-related injuries = 29%
Cardiac deaths = 63%
The Saints managed to register the fourth-highest incidence rate of TV-related injuries of any team we examined. Many of these injuries could possibly be due to the Saints’ dramatic play calling. Just after halftime, the Saints recovered a surprise onside kick to set up a go-ahead touchdown.
Additional TV injuries probably happened after a commercial featuring a Fiat getting a boost from a special blue pill.
19. San Francisco 49ers
Appearances: 1 (2013)
Danger Factor: 0.76
The Aftermath:
TV-related injuries = 129%
Kitchen-related injuries = 60%
Football-related injuries = 23%
Cardiac deaths = 85%
San Francisco’s lone Super Bowl appearance during our study period was a strange one: The teams’ head coaches are brothers (Jim and John Harbaugh), a third-quarter power outage halted the game for 34 minutes, there was a 108-yard kickoff return for a touchdown and an intentional safety.
But despite ranking sixth overall for TV-related incidents (blackout anxiety?), the 49ers proved to be our safest Super Bowl participant.
Super Bowl XXXIII, 1999: The Most Dangerous Super Bowl
On January 31, 1999, the seldom-used Howard Griffith rushed for two touchdowns to help lead the Broncos to their second consecutive title in John Elway’s final game before retirement.
But did you know that Super Bowl XXXIII was the most dangerous for fans watching at home in the past 20 years? Fans suffered TV-related injuries at almost twice the normal rate for that year, while also suffering over 1.5 times the average rate of kitchen injuries.
The very next year saw the second most-dangerous Super Bowl, when the Titans took on the Rams. While the rate of kitchen-related accidents was marginal that day, TV-related injuries jumped up 184% and cardiac deaths tied the 1999 total of 126% of the normal average.
In fact, three of the four most dangerous Super Bowls were those played in 1999, 2000 and 2001.
By comparison, the safest Super Bowl came in 2013, when the Ravens clipped the 49ers 34-31. That weekend was the safest in the kitchen, tied for the safest on the civilian football field and featured the third-smallest spike in cardiac deaths.
Before the six most dangerous Super Bowls, the pre-kickoff coin toss showed tails five times. Before the five safest games, the coin landed heads up three times.
Forecasting the 2020 Super Bowl
If historical data is any indication of future outcomes, the 2020 Super Bowl is shaping up to be a Hail Mary pass. In other words, a total crapshoot.
On the one hand, the San Francisco 49ers proved to be the safest Super Bowl team we studied, which bodes well for a low-key 2020 Super Bowl weekend.
On the other hand, the Kansas City Chiefs are making their first Super Bowl appearance in 50 years. And according to our data, that could point to trouble.
- Each of the five most dangerous Super Bowl games we studied featured a team who was making their first appearance in the big game in 20 years or more.
- Seven of the eight most dangerous Super Bowl teams we studied were making their first Super Bowl appearance in at least 20 years.
Throw in the fact that Miami has played host to two of the most dangerous games we studied (1999 and 2010), and you have all the makings of a Super Dangerous Sunday.
Enjoy the big game this year, and do it safely.
Conclusions
We couldn’t find a direct correlation between the margin of victory in the Super Bowl and the at-home accidents that occurred over that weekend. We similarly did not see any causality between upset victories (when the favored team going into the Super Bowl lost the game) and the number of accidents.
Our research and the previous studies we reviewed do, however, suggest that some fanbases may experience increased rates of deaths related to heart disease, heart attacks and other circulatory issues when their favorite team loses a major championship.
Regardless of who is playing, injuries and cardiac deaths seem to spike around the Super Bowl. The rate of kitchen injuries specifically tends to rise sharply around holidays and events like the Super Bowl, when families and friends gather and people increasingly prepare homemade food.
In the end, we recommend that fans use caution, stay aware and practice moderation and safety when gathering to watch the Super Bowl in 2020 and in years to come.
Summaries of other health studies
Carroll, D., et al. (Dec. 21, 2002). Admissions for myocardial infarction and World Cup football: database survey [Abstract]. BMJ, 325, 1439. doi.org/10.1136/bmj.325.7378.1439.
Summary
The risk of ER admission for a heart attack increased by 25% on the day England lost to Argentina in the 1998 World Cup match (which ended in a penalty kick shootout) and for the two following days.
The increase indicates die-hard fans of England football (soccer, for us Americans) could be emotionally invested in an important game to the point of having a heart attack if they lose.
Wilbert-Lampen, U., et al. (Jan. 31, 2008). Cardiovascular events during World Cup soccer [Abstract].. New England Journal of Medicine, 358(5), 475-483. doi: 10.1056/NEJMoa0707427.
Summary
When Germany hosted the World Cup in 2006, the host nation fans showed a drastic increase in coronary emergencies when the German team was playing.
The rate of acute cardiovascular events such as heart attacks more than doubled for the period during the first 2 hours after a game started that involved the German national team.
Kloner, R., et al. (June 15, 2009). Comparison of Total and Cardiovascular Death Rates in the Same City During a Losing Versus Winning Super Bowl Championship. American Journal of Cardiology, 103(12), 1647-1650. doi.org/10.1016/j.amjcard.2009.02.012.
Summary
When the L.A. Rams lost to the Pittsburgh Steelers in the 1980 Super Bowl, there was a notable increase in rates of death due to circulatory issues, heart attack and heart disease during the day of the Super Bowl and for fourteen days after in Los Angeles County.
In contrast, when the L.A. Raiders defeated the Washington Redskins in the 1984 Super Bowl, the rate of “all-cause deaths” in Los Angeles County decreased for the two-week period after the game.
Schwartz, B.G., et al. (Aug. 27, 2013). Super Bowl outcome’s association with cardiovascular death. Clinical Research in Cardiology, 102, 807-811. doi:10.1007/s00392-013-0593-y.
Summary
When the New England Patriots lost to the New York Giants in the 2008 Super Bowl, circulatory deaths increased by 20% and heart disease deaths increased by 24% in Massachusetts over the following eight days.
Conversely, when the Pittsburgh Steelers defeated the Arizona Cardinals in the 2009 Super Bowl, heart disease deaths decreased by 31% and heart attack deaths decreased by 46% in Pittsburgh.
Tulane University. (Feb. 1, 2016). Super Bowl celebrations spread flu, according to researchers. ScienceDaily. Retrieved from www.sciencedaily.com/releases/2016/02/160201220016.htm.
Summary
Influenza deaths increased 18% for adults over 65 when their local NFL team played in a Super Bowl between 1974 and 2009.
No discernable corresponding increase in flu-related deaths was seen in cities that hosted the Super Bowl, which suggests older adults are more susceptible to flu transmission at public gatherings to watch the Super Bowl.
Ahrens, M. (Nov. 2019). Home Cooking Fires. Retrieved from www.nfpa.org/-/media/Files/News-and-Research/Fire-statistics-and-reports/US-Fire-Problem/Fire-causes/oscooking.pdf.
Summary
Thanksgiving and other “holidays associated with food” are by far the leading days for home cooking fires. Increased cooking combines with guests, television and other factors to cause kitchen distractions and accidents.
Methodology
The study was conducted by analyzing data from the National Electronic Injury Surveillance System (NEISS), provided by the U.S. Consumer Product Safety Commission. Using the NEISS Estimates Query Builder, we collected data for reported injuries related to TVs, certain kitchen appliances and recreational football for the day before, the day of and the day after the Super Bowl for each respective year between 1999-2017.
For cardiac deaths, we queried the CDC WONDER database to find the rates of cardiac death in the home county of each Super Bowl team for each February in which they played in the Super Bowl, from 1999-2017.
To calculate each team’s “Danger Factor:”
- We compared the average daily incidence rate of each injury category (TV-, kitchen- and football-related) for the three days around the Super Bowl in each given year to the average daily incidence rate of each category for the rest of that year. These values are expressed as a percentage of the average daily rate for that year.
- We then compared the number of cardiac deaths as described above to the average cardiac death rate for all February months in each Super Bowl team’s home county from 1999-2017. The death rate values for each team’s appearance in the Super Bowl are expressed as a percentage of the average cardiac death rates for all February months from 1999-2017.
- We then calculated an overall deviation from the average rate of injuries and cardiac deaths for each team, with cardiac death receiving a weighting factor of two. This overall deviation value is the Danger Factor.
Notes
While we tried to remain as scientific as possible in our methodology, any study of health remains highly subjective. These results show an association but do not prove causality.
NEISS injury data is not localized and is compiled from sources around the country. We did not use the NEISS national estimates for injury incidents, but rather the raw reported cases for each category in each time period observed. We compared these reported cases against an average of the annual reported cases provided by NEISS. A more detailed examination of injury data in and around the metro area of a Super Bowl team could yield additional insight.
The CDC WONDER data we gathered applies to the specific populations of the county for each Super Bowl team’s home city.
Some team fanbases may also penetrate nationwide at a higher rate than some other teams who have appeared in the Super Bowl.
Research Contact
Ryan Shevin: ryan@tzhealthmedia.com
Fair Use Statement
Of course we would love for you to share our work with others. We just ask that if you do, please grant us the proper citation with a link to this study so that we may be given credit for our efforts.
Contributors
- Tina Tan, M.D., M.P.H., New Jersey State Epidemiologist, NJ Department of Health
References
Injury data and cardiac death statistics retrieved from the following data sources:
- United States Consumer Product Safety Commission. (2020). NEISS Highlights, Data and Query Builder [Data file using injury codes 519 and 572; all “cooking ranges/ovens” subcategories and codes 422, 416, 941, 215, 213, 212, 219, 222, 223, 231, 218, 471, 275, 221, 412, 241, 469, 268 and 234; and code 1211]. Retrieved from www.cpsc.gov/cgibin/NEISSQuery/home.aspx.
- Center for Disease Control and Prevention. (2020). CDC WONDER Underlying Cause of Death 1999-2017 [Data file]. Retrieved from wonder.cdc.gov/controller/datarequest/D76.
Research and reports
Our research reports analyze a number of issues important to seniors, from health perceptions, medical communication, health habits, and more.